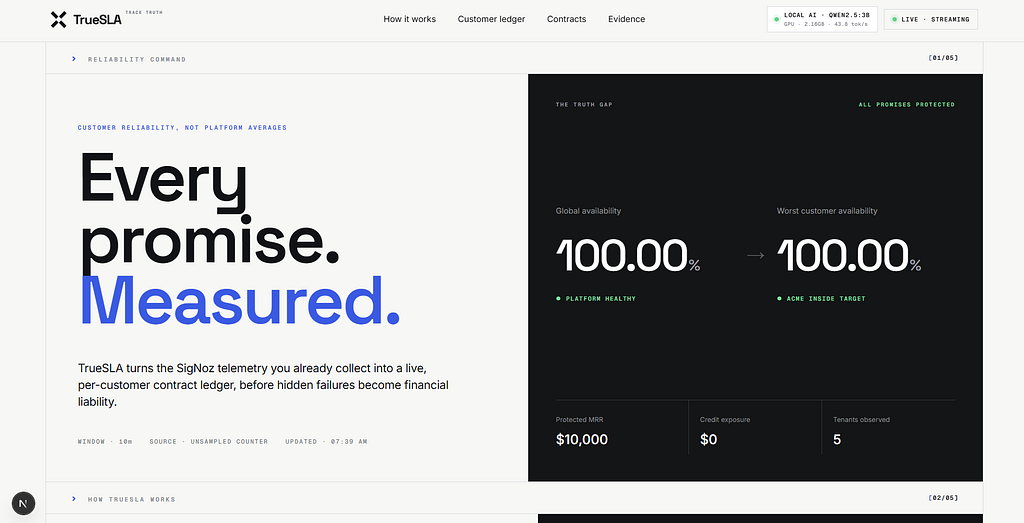
The average was green. One customer was on fire.
Code: github.com/RajdeepKushwaha5/TrueSLA
Demo video: youtu.be/z8B42TCVReQ
Live: true-sla.vercel.app
I did not begin this hackathon planning to build an SLA product. I began with a question that kept bothering me:
If the dashboard says the service is 99.9% available, which customer is that average hiding?
A shared platform number can look healthy even when one small customer is having a terrible day. The information needed to expose that problem is often already inside the telemetry. It is just grouped by service instead of by customer.
TrueSLA changes that grouping. The demo service records every request in an unsampled OpenTelemetry counter and sends tenant-tagged traces to SigNoz. TrueSLA reads the counter through SigNoz MCP, calculates availability for each customer, and compares that result with the customer’s contract. Traces are then used for p95 latency, failed-request samples, and the call path behind a failure.
When a customer crosses a contract target, TrueSLA opens a breach, estimates the provisional credit exposure, starts a Credit Clock, and creates a checksummed evidence bundle. It also provisions customer-specific alerts and a cross-signal dashboard inside SigNoz.
SigNoz is load bearing here. It stores the measurements, traces, and logs. It is also where the alerts live and where TrueSLA observes its own refresh loop and MCP calls. Remove SigNoz and there is no customer health to calculate and no failure trace to use as evidence.
The demo uses a synthetic shop and a rolling ten-minute window. A credit shown on the screen is a provisional estimate in a local ledger, not an invoice or an automatic refund.
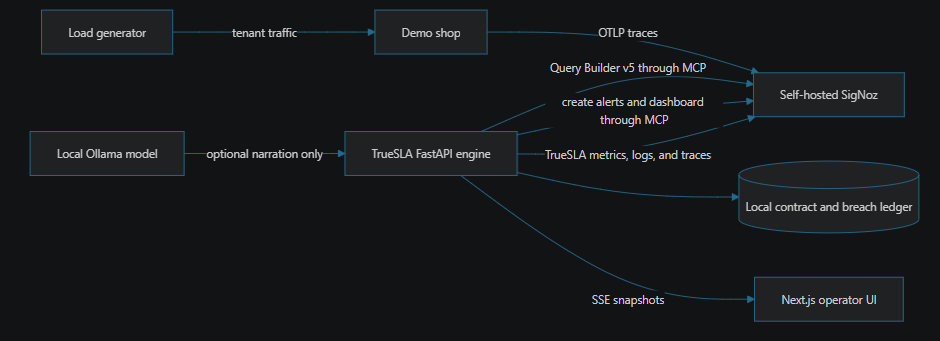
The split is deliberate. SigNoz owns the observable facts. Python performs the deterministic contract calculation. SQLite keeps the local review trail. Ollama can explain an already-computed result, but it cannot decide whether a customer breached a contract.
The killer moment, in one screen
The shortest explanation of TrueSLA is the fault demonstration.
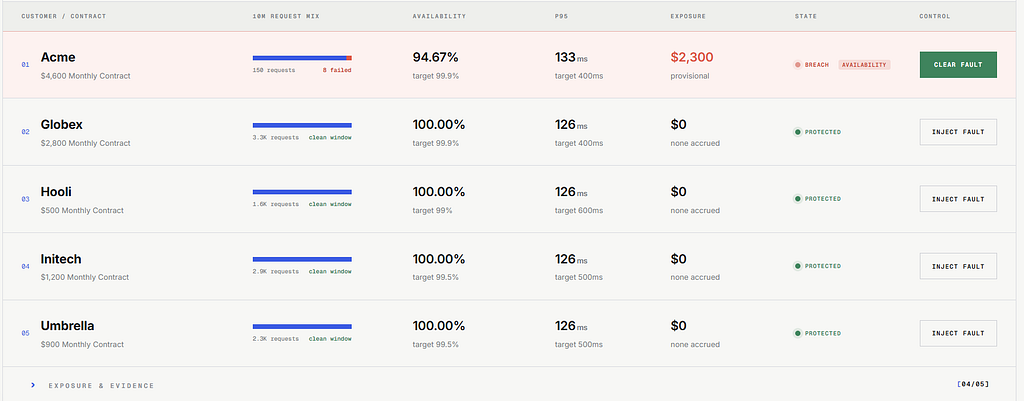
Five customers use the same service. I turn on a fault for only acme. The other four customers keep working normally.
GLOBAL AVERAGE    99.9%   still healthy
  acme            97.9%   BREACH   $1,150 provisional exposure
  globex         100.0%   protected
  initech        100.0%   protected
  umbrella       100.0%   protected
  hooli          100.0%   protected
Acme is a small part of the traffic but has the most valuable contract. Its failures barely move the global denominator, so the platform average stays green. Acme’s own number does not.
The screen shows the missed target, the provisional exposure, the next credit tier, and an estimate of how long it may take to get there. Behind that row is a real SigNoz alert, failed trace samples, and an evidence report pointing to the deepest failing dependency.
When I clear the fault, new failures stop. The existing breach does not vanish immediately because the failed requests remain inside the rolling window. I prefer that behavior. A recovery switch should stop new damage, not erase what the customer already experienced.
This is not hypothetical
The problem has two sides.
First, a green status can lag behind what users are experiencing. During the AWS incident on December 7, 2021, ThousandEyes observed failures for nearly an hour before the AWS status page reflected an issue. That is a platform-scale example, but the lesson is the same: one summary indicator is not the same as every customer’s reality. (ThousandEyes outage analysis)
Second, an SLA credit can require the affected customer to submit a claim and provide evidence. Microsoft’s Partner Center guidance, for example, asks for the customer tenant ID, outage ID, proof of impact, and a request within a stated deadline. A normal support ticket by itself is not enough. (Microsoft: request a credit)
I wanted to connect those two problems. If a service already emits tenant-tagged telemetry, the evidence should be captured while the incident is happening. It should not depend on somebody rebuilding the story from screenshots weeks later.
The rest of this post follows the build in the order it happened, from July 20 to July 26. Some early choices were later replaced. I have kept them here because the mistakes explain why the final architecture looks the way it does.
Day 1 (July 20, 2026): The gap I could not unsee
Day one was mostly plumbing. I needed a multi-tenant service that behaved like a real application rather than a page generating random numbers.
I built a small shop called shopfront. A checkout request calls payment.authorize, which calls ledger.db.query. The service receives a tenant header for controlled demo traffic and adds customer.tenant to the request telemetry. In production that value must come from trusted authentication or ingress context, not from a header supplied by an end user.
The first per-customer number
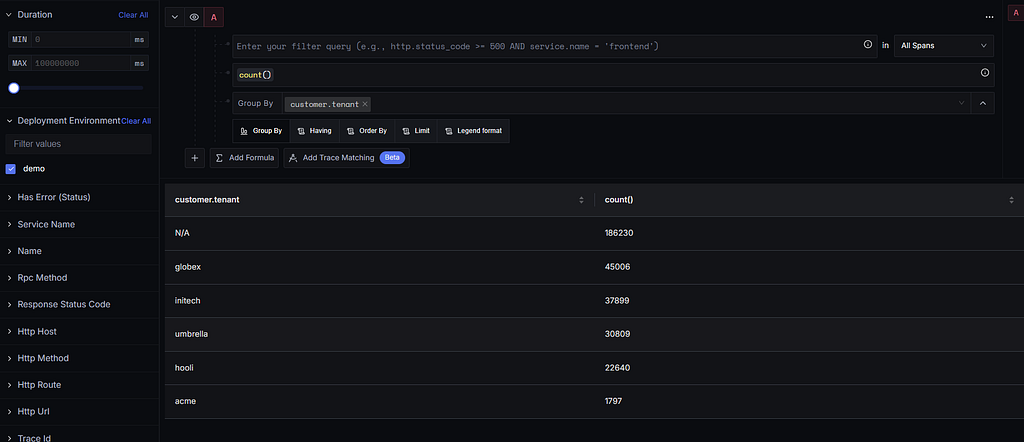
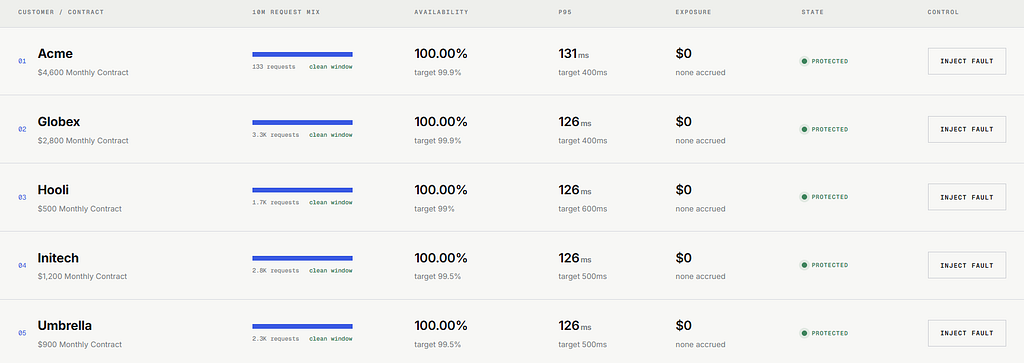
Once traffic reached SigNoz, I grouped the requests by customer.tenant. Instead of one service number, I got five:
globex   2043 requests   p95 143ms   100.0%
initech  1694 requests   p95 145ms   100.0%
umbrella 1115 requests   p95 134ms   100.0%
hooli     558 requests   p95 153ms   100.0%
acme      286 requests   p95 149ms   100.0%
Nothing was broken, so all five rows were healthy. The useful part was not the 100%. It was seeing that the same service contained five different customer stories.
Acme had less traffic than the others. Later I also gave it the strictest and highest-value contract. That combination is what creates the blind spot: small enough to disappear inside the global average, important enough that missing its promise matters.
Why per-customer and not just per-service
A service dashboard answers, “How is the service doing overall?” That is a valid question, but it is not the same as, “Did Acme receive the reliability we promised?”
The tenant attribute was already present in the telemetry. The blind spot appeared only after all tenants were combined into one denominator. Day one was the point where I realized the project did not need a new source of truth. It needed a different unit of reliability.
Day 2 (July 21, 2026): Reading the truth out of SigNoz
The next step was turning those grouped records into a number I could compare with a contract.
Availability is a formula, not a count
My first thought was to count failures. That number is meaningless without a denominator.
Ten failed requests out of twenty is an outage. Ten out of one hundred thousand is a very different situation.
The calculation is:
availability = 100 × (1 - failed requests / total requests)
At this stage of the build I calculated that ratio from grouped trace counts. I also queried p95 latency because an average can hide the slow tail. Availability was the first contract decision; latency was initially only displayed beside it. Both of those choices changed on the final day after I tested the design against production sampling and latency-only failures.
The queries went through SigNoz Query Builder and MCP rather than reading ClickHouse directly. That kept TrueSLA on the same supported path an operator uses and made the measurement easier to inspect.
SigNoz documents the same errors / total formula pattern for alerting. (Trace-based alerts)
The bug that made everything take 21 seconds
Every MCP request took about 21 seconds. Small query, large query, it did not matter. I blamed the database first.
The database was fine.
On my Windows setup, localhost tried IPv6 before falling back to IPv4. That failed connection attempt was the delay.
http://localhost:8000/mcp     about 21,000 ms
http://127.0.0.1:8000/mcp        about 575 ms
Changing one hostname made the loop roughly forty times faster. I now use 127.0.0.1 for local program-to-program connections and reserve localhost for links a person opens in the browser.
SigNoz kept looking like it was crash looping
The next problem looked worse. Every SigNoz container seemed to have restarted only a few seconds earlier.
It was not a SigNoz crash. WSL2 was shutting down its virtual machine when nothing remained active inside it. The next command woke the stack again, which made every container look newly started.
The start workflow now keeps a process alive inside WSL before the rest of the demo begins. It was a small environmental fix, but without it SigNoz could go to sleep halfway through a recording.
Day 3 (July 22, 2026): Contracts, credits, and one honest number
Per-customer availability becomes useful when it is placed next to the promise made to that customer.
Contracts and credit tiers
Each demo customer has an availability target, latency target, and monthly fee. Acme has a 99.9% target and a $4,600 monthly contract. Hooli has a 99.0% target and a $500 contract.
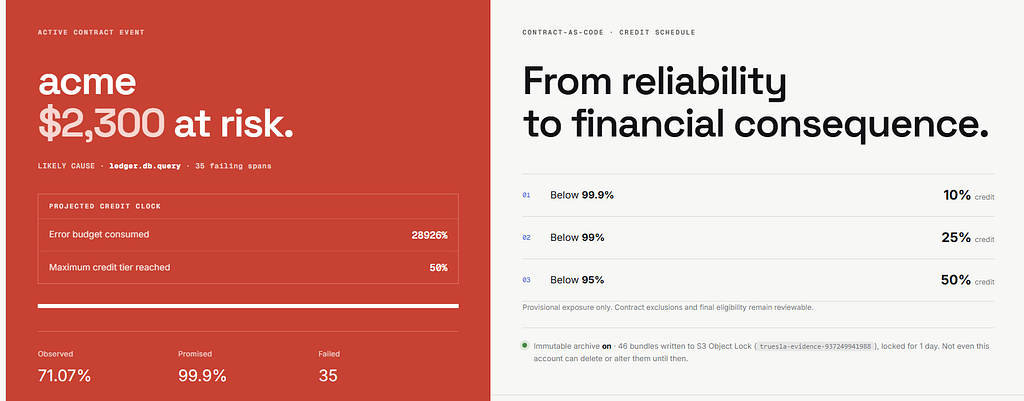
The demo credit ladder is:
below 99.9%   -> 10% credit
below 99.0%   -> 25% credit
below 95.0%   -> 50% credit
The most severe crossed tier wins. The amount is calculated from that customer’s monthly fee, so the same availability can create very different exposure for two customers.
The demo applies the ladder to a rolling ten-minute operational window. A real SLA normally settles over a billing period and includes maintenance windows, exclusions, and claim rules. That is why the interface consistently calls the result provisional exposure.
The consistency rule I made myself follow
At one point the headline availability and credit amount came from slightly different reads. Rounding made them disagree.
That is a minor UI bug in many products. In a tool showing money, it damages the entire result.
I changed the flow so one evaluation produces the availability, credit tier, amount, summary inputs, and evidence snapshot together. Every evaluation is appended to the measurement history. The breach headline changes only when a new worst measurement appears, and all of its fields change in one database transaction.
There is a test specifically guarding that rule.
Day 4 (July 23, 2026): The Credit Clock
Monthly SLA reports explain what happened after the useful response window has already closed. I wanted a number that could change what an operator does now.
Counting down to the next credit tier
The Credit Clock watches recent failure arrivals and estimates when the current rolling fraction may cross the next tier.
For example:
acme availability:       99.3%
current exposure:        10% = $460
next boundary:           below 99.0%
next exposure:           25% = $1,150
additional exposure:     $690
estimated time:          about 20 seconds
That turns the page from a report into a warning. The incident is getting more expensive while somebody can still respond.
The number is intentionally labelled as an estimate. The current model extrapolates recent failure arrivals. A production forecast should also model successful request arrivals and the exact contract-period boundary.
Being honest when there is not enough data
Three requests are not enough evidence for a financial claim.
TrueSLA has a minimum-support rule. A customer below the threshold is shown as low-data. The engine does not open a breach or calculate exposure from that window, even if all three requests failed.
This made the demo slightly slower because Acme had to collect enough traffic before it could be judged. It also made the result much easier to defend.
Day 5 (July 24, 2026): Proof, cause, and the alert in SigNoz
Once the screen started showing money, a red row was not enough. Every breach needed a receipt.
Evidence as code
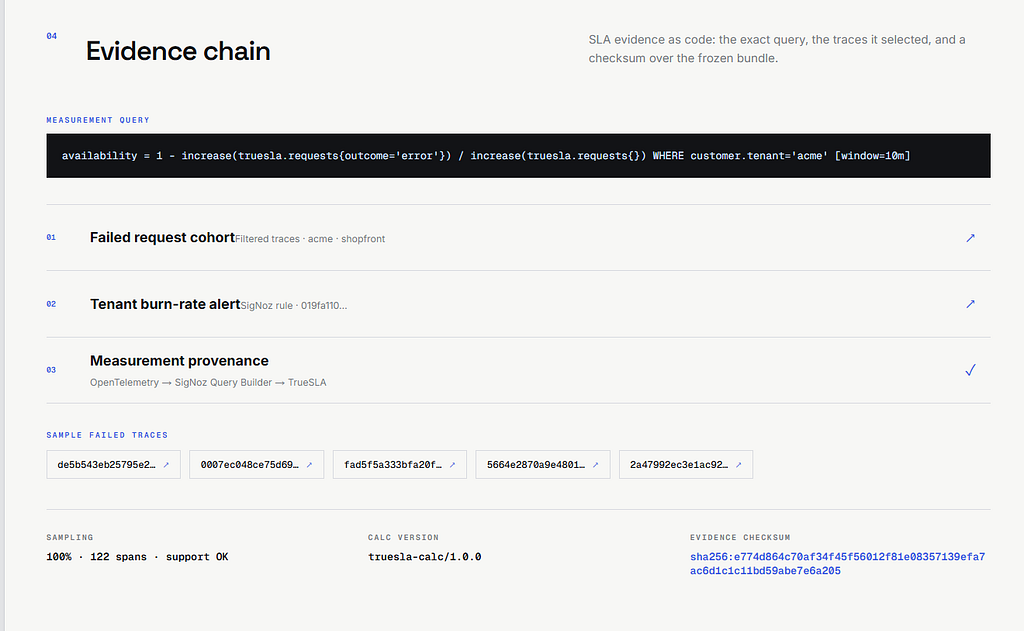
When a breach opens, TrueSLA freezes an evidence bundle containing:
- The measurement expression and time window
- The SLI source and sampling disclosure
- Total and failed requests
- Measured availability and contract target
- Applied credit tier and amount
- Calculation version
- Failed trace samples
- The suspected dependency
- A full SHA-256 checksum
Later worsening measurements are appended to the history. When a new worst point appears, a new evidence revision is created.
{
  "tenant": "acme",
  "measured": {
    "availability": 79.5,
    "errors": 50,
    "total": 244
  },
  "likely_dependency": "ledger.db.query",
  "sampling": "100%",
  "checksum": "sha256:50870dae09d21216..."
}
The checksum makes an edit visible. It does not by itself stop somebody with database access from changing the file and recomputing the hash. I dealt with that remaining problem on Day 7.
The evidence points to the likely dependency
At this point, the first implementation grouped failing span names and selected the most common one. In the demo, ledger.db.query rose to the top and gave the operator a useful place to start.
It was still an inference. A parent span and its failing child can both be marked as errors, so counting names does not prove which one caused the failure. I kept the trace links in the report and later replaced this ranking with a real parent-child trace walk.
The alert lives in SigNoz, and it is created before the breach
My early version created an alert only after a breach opened. That is backwards. An alert created after the contract fails is a historical record, not a warning.
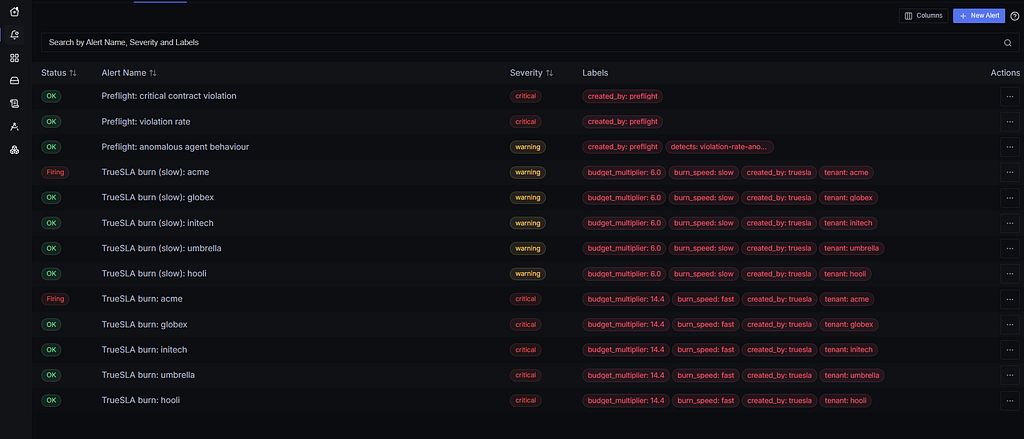
I moved alert provisioning to startup and contract creation. Each customer got a SigNoz rule scoped to that tenant and derived from the customer’s allowed error fraction. The rule ID is attached to the breach so the evidence page can open it directly.
At the end of Day 5 it was still a single error-rate alert. I was also using the word “burn rate” too loosely. The normalized, two-window burn design came on the last day.
The demo creates real alert rules inside SigNoz. Its default notification channel is only a local placeholder, so a production deployment must connect those rules to Slack, PagerDuty, email, or another real on-call destination.
The local model narrates, it does not decide
A small Qwen model running through local Ollama writes the short explanation on a breach.
It receives facts that the deterministic engine has already calculated. It cannot change the availability, credit, contract verdict, trace IDs, or checksum. If Ollama is unavailable, the backend uses a normal text template and the product continues working.
The summary is regenerated only when a breach reaches a new worst point. The refresh loop does not call the model on every pass, and no hosted model key is required.
Day 6 (July 25, 2026): Making it live, and watching itself
By Day 6 the pieces worked separately. The next job was making them behave like one operating system rather than a set of buttons.
The loop is the agent
I did not want to place a chat box beside a dashboard and call it an agent. TrueSLA runs its loop without waiting for an operator:
- Observe: read each customer’s telemetry from SigNoz.
- Decide: apply the support, contract, latency, and credit rules.
- Act: open or update a breach and keep the SigNoz controls ready.
- Explain: attach evidence and optionally generate a local summary.
MCP is the bridge in both directions. TrueSLA uses it for metric and trace queries, alert operations, notification-channel setup, dashboard creation, and alert history. It does not reach around SigNoz and query ClickHouse directly. (SigNoz MCP server)
The dashboard TrueSLA builds for itself
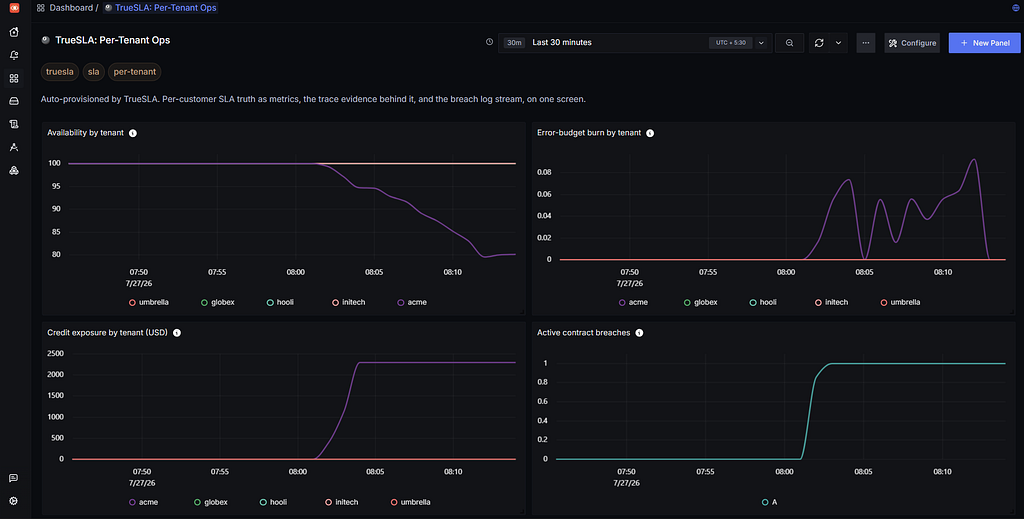
On startup, TrueSLA creates a nine-panel dashboard inside SigNoz:
- Availability by tenant
- Error-budget burn by tenant
- Credit exposure by tenant
- Active contract breaches
- Unsampled requests by tenant
- Unsampled failed requests by tenant
- Failed traces by tenant
- p95 latency by tenant
- Breach lifecycle logs
The board combines metrics, traces, and logs. An operator can see the customer number, move to the trace explaining it, and read the breach event without leaving SigNoz.
During development I created duplicate dashboards. The current demo reconciles them by replacing old TrueSLA boards at startup. For a real deployment I would keep a stable dashboard ID and update it in place so bookmarks and manual edits survive.
The screen moves without a manual refresh
The backend refreshes SigNoz on a configurable cadence and sends changed ledger snapshots to the browser through Server-Sent Events.
If the stream disconnects, the frontend falls back to polling. This sounds like a small UI detail, but it is what makes the demonstration work. Acme changes from green to red without the operator repeatedly refreshing the page.
TrueSLA observes itself
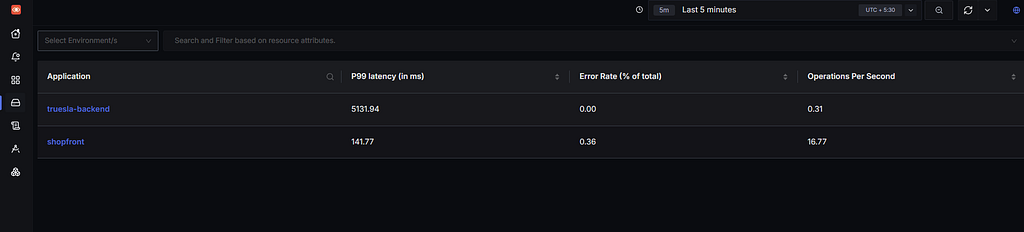
Every refresh pass and outbound MCP call is traced under service.name=truesla-backend.
That means the service making reliability decisions is itself measurable in SigNoz. If an MCP request slows down or a refresh takes too long, the same observability stack shows it.
All three signals, not just traces
The project began trace-only. That was not enough.
TrueSLA now emits first-class metrics for:
- truesla.sli.availability
- truesla.error_budget.burn_rate
- truesla.credit.exposure
- truesla.breach.active
- truesla.engine.refresh.duration
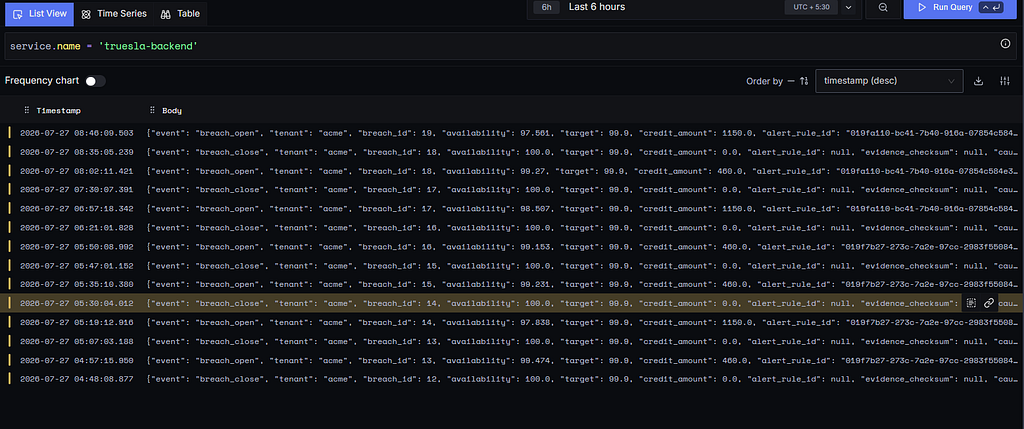
It also emits structured lifecycle logs. The breach-open log contains the tenant, credit, alert rule ID, evidence checksum, causal span, and S3 object key when archiving is enabled. The close log records the lifecycle transition.
{
  "event": "breach_open",
  "tenant": "acme",
  "availability": 99.153,
  "credit_amount": 460.0,
  "alert_rule_id": "019f7b27-273c-7a2e-97cc-2983f5508495",
  "evidence_checksum": "sha256:c3dd4e8d75da5062...",
  "causal_span": "ledger.db.query",
  "evidence_s3_key": "evidence/acme/1785111605-c3dd4e8d75da5062.json"
}
Metrics answer how much and how fast. Logs mark the lifecycle. Traces explain what failed. That division is more useful than treating them as three boxes to check for a hackathon. (SigNoz dashboard interactivity)
At the end of Day 6, traces were still the availability source. The new metrics only charted TrueSLA’s derived state. That sampling mistake became the first thing I fixed on Day 7.
Day 7 (July 26, 2026): Proving the number, not just showing it
The loop worked. Acme turned red, a credit appeared, and the evidence looked convincing.
That was when I became more worried about false confidence than missing features.
Showing one breach proves almost nothing
A system that marks everything as a breach has perfect recall and no value. Here it is worse than noisy. A false positive can attach money to an incident that never happened.
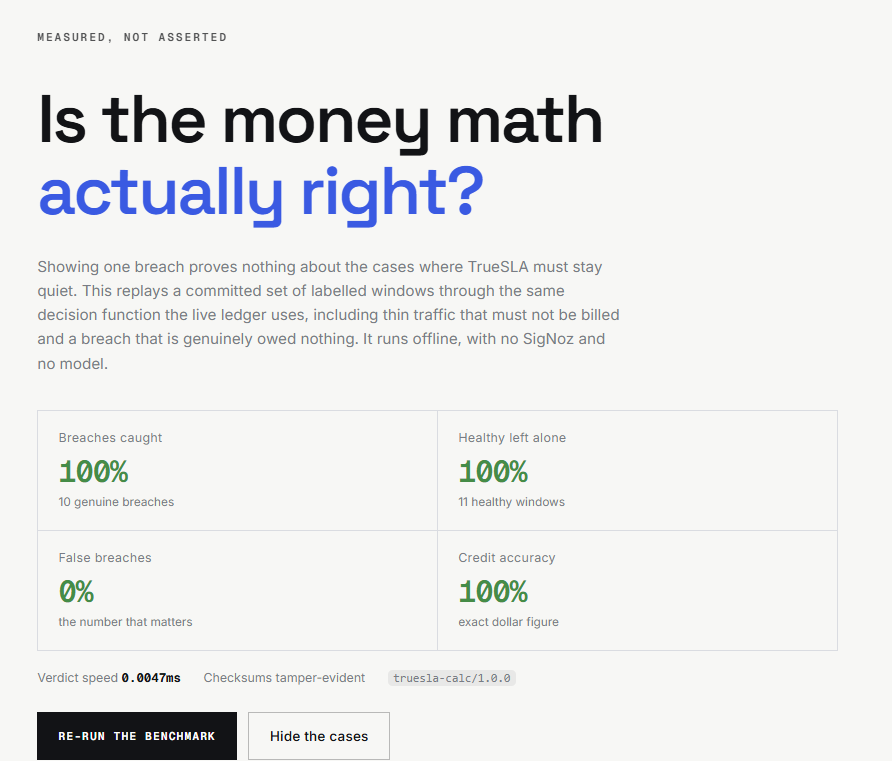
I wrote a committed set of labelled windows and replayed them through the same pure engine.decide function used by the live ledger.
The cases include:
- Every request failed, but there were too few requests to judge
- A customer exactly on the contract target
- A real breach that has not crossed a credit tier
- Exact credit boundaries
- An unprotected tenant
- A customer with 100% availability but a latency breach
- A customer missing both availability and latency
There are 21 cases: 10 genuine breaches and 11 windows that must remain non-breached.
breach recall        100.0%   (10 genuine breaches)
healthy pass rate    100.0%   (11 healthy windows)
false breaches         0.0%
credit accuracy      100.0%
status accuracy      100.0%
The benchmark also checks the reason. A latency failure reported as an availability failure is not considered correct.
The decision benchmark runs offline with no model, traffic, or SigNoz. Its result is also emitted as a span when invoked through the application. Tests deliberately replace the evaluator with one that breaches everything and one that inflates every credit, then confirm the benchmark fails.
The current repository has 210 passing backend tests in total.
A receipt the customer can keep
The first evidence page required my backend to render. I did not like that. A customer should not need my service to stay online just to open the proof.
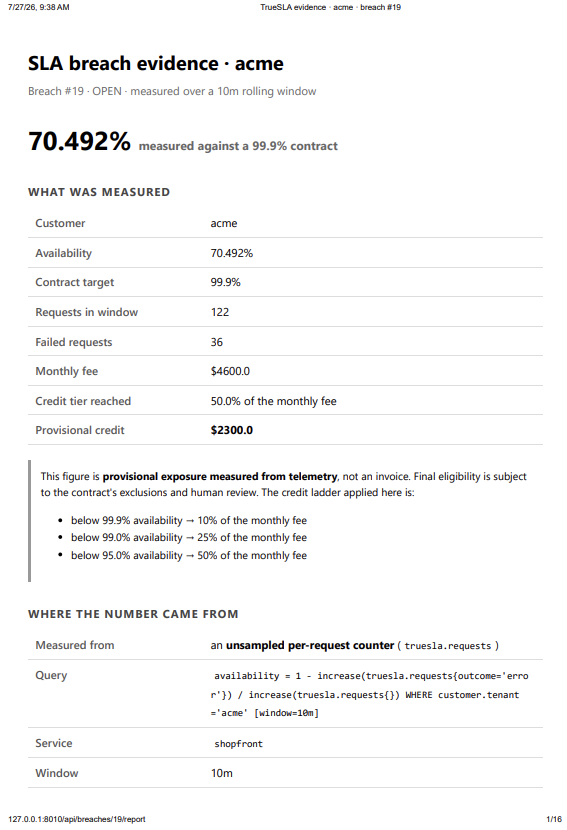
TrueSLA now creates a self-contained HTML receipt for each breach. Its styles and data are inline, so it opens with nothing running.
The receipt includes the measurement, contract, credit ladder, SLI provenance, trace samples, likely cause, and checksum. When opened, it recomputes the checksum from the embedded evidence and displays VALID or MISMATCH.
It also says provisional exposure, not invoice. Final eligibility remains subject to the real contract and human review.
Putting the proof somewhere it cannot be edited
A checksum detects changes only if the trusted original checksum remains trustworthy. Somebody with database access could edit a local bundle and compute a new hash.
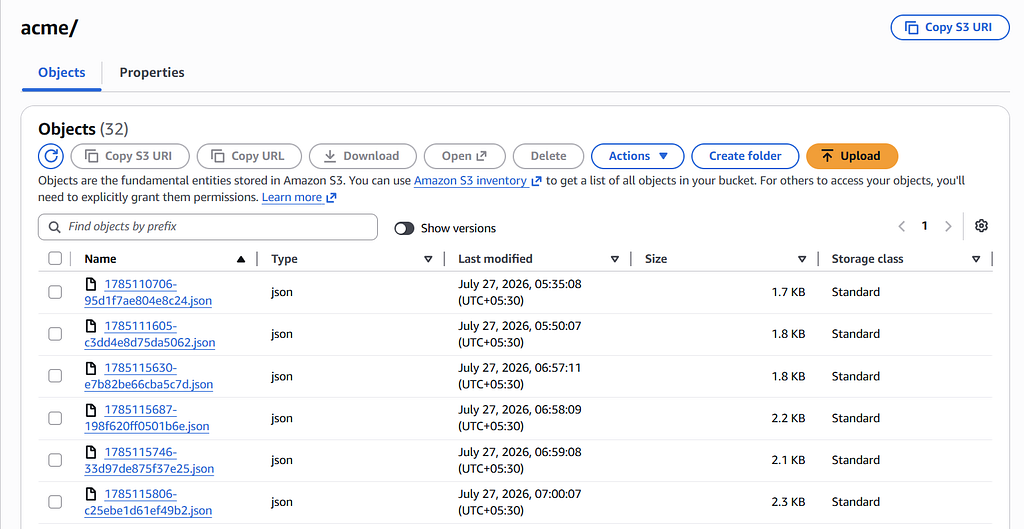
I added an optional Amazon S3 Object Lock archive. When configured, every new or worsening evidence bundle is written as a separate object in compliance mode. During its retention period, that object version cannot be overwritten or deleted, including by the AWS account root user. (AWS Object Lock documentation)
The archive is optional. Without a bucket, TrueSLA continues using the local checksummed evidence. If S3 is unavailable, breach detection continues and the archive failure is reported instead of crashing the engine.
Seventeen tests cover the archive path, including retention metadata, unique tenant keys, checksum verification after reading an object back, tamper detection, and fail-soft behavior.
I then enabled it against a real AWS bucket. The setup script wrote a test object, applied one-day compliance retention for the demo, and attempted a version-specific delete. AWS returned AccessDenied, and the object remained.
Attempting a hard delete of the retained object version...
AWS REFUSED: AccessDenied
Object still present after the delete attempt
The one-day duration makes cleanup practical after the hackathon. Compliance mode provides the same protection for whatever retention period is configured.
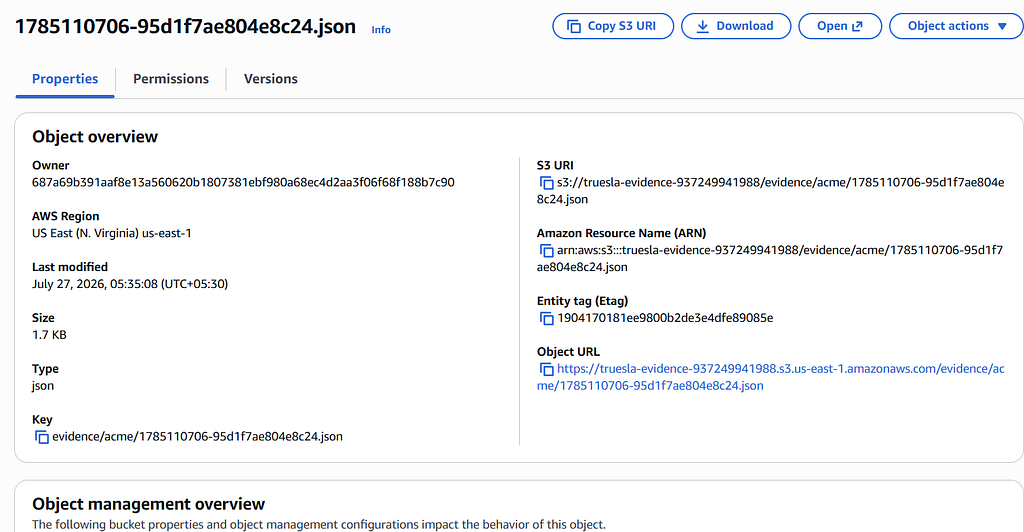
TrueSLA can also read a stored bundle back and recompute its checksum:
{
  "checksum_valid": true,
  "object_lock_mode": "COMPLIANCE",
  "tenant": "acme"
}
The repository also contains Terraform for a larger AWS deployment using ECS Fargate, Postgres, ADOT, self-hosted SigNoz, and AWS Fault Injection Service. Acme is routed to a dedicated shard so an infrastructure experiment can affect one customer instead of the whole service.
I did not apply that Terraform because it creates billable infrastructure. It is a documented production path, not something I claim to have run. The S3 archive is the AWS feature I ran live.
The bug that would have refunded money nobody earned
This was the most important correction of the week.
Until this point, availability was calculated from traces:
failed entry spans / total entry spans
That is exact only if every trace is retained. Production systems often tail-sample, keeping failures while discarding many successes. Under that policy the numerator remains large while the denominator shrinks. The calculated error rate becomes much worse than the error rate customers actually experienced.
For an ordinary chart, that is misleading. For TrueSLA, it could create a credit for an outage that did not happen.
The demo service now increments one OpenTelemetry counter for every request, independently of the trace-sampling policy:
REQUESTS = meter.create_counter(
    "truesla.requests",
    description="Requests served per customer, tagged by outcome"
)
TrueSLA reads the counter through signoz_query_metrics, using its increase over the evaluation window and grouping by tenant and outcome.
Metrics count the breach. Traces explain it.
A missing error series means zero failures, not missing customer data. If the counter cannot be queried, TrueSLA deliberately falls back to traces and places a sampling warning inside the evidence bundle.
{
  "kind": "metrics",
  "metric": "truesla.requests",
  "sampling_safe": true
}
Blaming the right span
The original dependency ranking counted failed span names. It often produced the right answer, but it could not separate a real failure from a parent propagating its child’s error.
A failed checkout looks like this:
GET /checkout
  payment.authorize
    ledger.db.query   <- deepest failing span
TrueSLA now fetches a real failed trace using signoz_get_trace_details, reconstructs the parent-child tree, and chooses a failing leaf with no failing children. If several independent leaves fail, it prefers the slowest one. It then walks back to the entry span to recover the path.
root cause : ledger.db.query
dependency : postgresql / INSERT charge
path       : GET /checkout -> payment.authorize -> ledger.db.query
The evidence records method: trace-hierarchy. If a full trace cannot be read, the older name-ranking method remains as a clearly labelled fallback.
Two alerts per customer, not one
A single short alert window catches spikes but becomes noisy. One long window misses a fast outage.
TrueSLA now provisions two metric-based rules for each contracted customer:

Both calculate failed requests / total requests from the same unsampled counter used by the ledger. Each threshold is derived from that customer's contract, so Acme's 99.9% promise is treated differently from Hooli's 99.0%.
The demo windows are shorter than a normal production SLO setup so the behavior can be observed during the hackathon. Real windows should come from the contract period and paging policy.

I also found stale alert rules from the earlier trace-based version. The name matched, so the provisioning code assumed the rule was current.
Rules now carry a burn_speed label. A matching name without the current label is replaced. Rules belonging to deleted contracts are pruned. The test suite also blocks real MCP access unless a test explicitly enables it, so temporary test customers cannot leak into the live SigNoz instance again.
Latency is half the contract
Every contract had a latency_target_ms field, but for most of the week it was display-only.
That was not honest contract enforcement. A service can return every request successfully and still be unusable because each one takes several seconds.
Latency can now open a breach independently:
1000 requests
0 failures
p95 = 900ms
contract p95 target = 400ms
result = BREACH: latency
The included credit ladder is based on availability. A latency-only breach therefore reports zero provisional credit rather than inventing a financial rule that is not in the contract.
The check that caught me out
The end-to-end verifier fails if Acme breaches while the global average drops below 99.5%.
That check sounds strange until you remember the product thesis. If the global number turns red too, it is not hiding the customer failure.
An early run failed this check at 99.369%. Acme was still about 5% of traffic, and previous fault traffic remained in the rolling window.
I changed Acme to one request out of every eighty, or 1.25% of traffic. At that share, even a 25% Acme failure rate reduces global availability by only about 0.31 percentage points.
The correction was not lowering the verifier threshold. It was making the demo traffic match the problem I claimed to solve.
Where it stands, and what I think
Where it stands
The current implementation includes:
- A multi-tenant OpenTelemetry demo service with a tenant-scoped fault switch
- An unsampled request counter as the authoritative availability source
- Per-customer p95 latency from SigNoz traces
- Availability and latency contract enforcement
- A low-data guard
- Deterministic credit calculations
- A live Credit Clock estimate
- Append-only breach measurement history
- Trace-hierarchy failure analysis with a labelled fallback
- Metric, trace, and log signals inside SigNoz
- Two customer-specific burn alerts per contract
- A self-provisioned nine-panel SigNoz dashboard
- Alert history queried back through MCP
- Backend and MCP self-observation
- Server-Sent Events with polling fallback
- A 21-case decision benchmark
- 210 passing backend tests
- Self-contained evidence receipts
- Optional S3 Object Lock archiving
- Optional shared-key write protection for contract and fault endpoints
- Foundry deployment files for reproducible SigNoz setup
In one recorded full run, Acme fell to about 90.4% while the global average remained at 99.88%. The engine calculated $2,300 of provisional exposure, identified ledger.db.query through the trace hierarchy, stored checksummed evidence, and generated a portable receipt that verified itself.
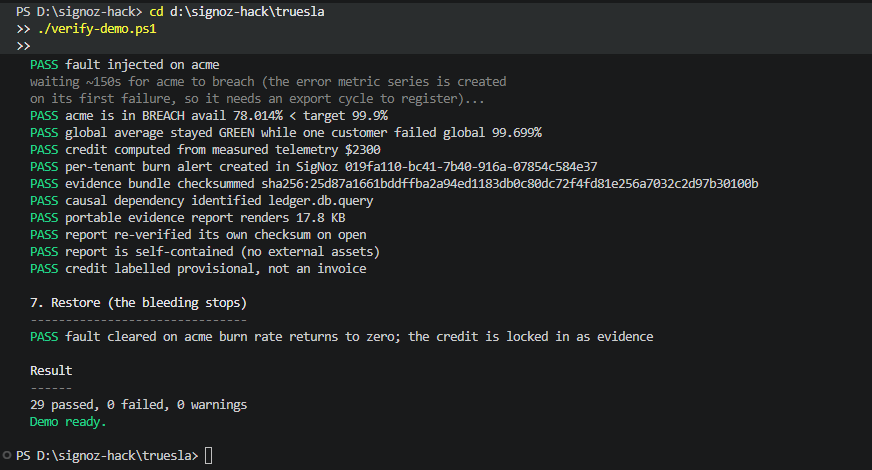
The verifier drives the live loop. It checks infrastructure, telemetry, benchmark results, the global-average blind spot, breach creation, credit, alert-rule linkage, evidence, causal dependency, portable receipt, and fault recovery.
PASS acme is in BREACH
PASS global average stayed GREEN
PASS credit computed from measured telemetry
PASS evidence bundle checksummed
PASS causal dependency identified
PASS report re-verified its checksum
29 passed, 0 failed, 0 warnings
Demo ready.
Running it
Everything needed for the local demonstration is in the repository. SigNoz is installed through Foundry, with casting.yaml and casting.yaml.lock checked in for reproducibility.
cp .env.example .env
# Add the SigNoz service-account key
cd backend
python -m venv .venv
.\.venv\Scripts\pip install -r requirements.txt
cd ..\frontend
npm install
cd ..
.\start-all.ps1
Then run:
.\verify-demo.ps1
Links:
- Repository: github.com/RajdeepKushwaha5/TrueSLA
- Video: youtu.be/z8B42TCVReQ
- Hosted UI preview: true-sla.vercel.app
To connect a real service, point TRUESLA_SERVICE at its SigNoz service name, set TRUESLA_TENANT_ATTR to the trusted tenant attribute, and attach contracts through the API or UI. The demo-specific pieces are the synthetic traffic and fault switch. The SigNoz queries, contract engine, evidence path, and alerts are the same code paths.
Why I would keep building it
The buyer I have in mind is a B2B SaaS company with enterprise contracts.
SRE owns the telemetry. Support handles the angry customer. Finance handles the credit. Legal owns the contract language. Those teams often do not share one incident record.
TrueSLA can turn a tenant attribute already present in telemetry into that shared record.
The next production steps are clear: separate the operational and billing windows, add maintenance exclusions, derive tenant identity from authentication, add roles and audit logs, sign evidence revisions, configure real notification channels, and evaluate several failed traces instead of one.
Those changes harden the boundaries. They do not require replacing the core idea.
What I actually think
The interesting part was never collecting more telemetry. SigNoz and OpenTelemetry already did that.
The interesting part was noticing that the number everybody watches is the one number that cannot tell you which customer you are failing.
The information was already there. It needed to be grouped by customer, compared with that customer’s promise, and preserved while the incident was still happening.
That is the moment I keep coming back to from the demo:
The average said everything was fine. Acme’s telemetry said otherwise. TrueSLA showed the contract risk while there was still time to respond.