How I Self-Hosted SigNoz on Windows (One Nasty Segfault and All)
How I fought a two-hour segfault, won, and fell for one small SigNoz feature along the way.
Let me be honest with you right from the start. Before I could see even a single trace inside SigNoz, I spent almost two hours fighting one very stubborn crash. And you know what? I would happily do it all over again, because what I got at the end was worth it.
This is my self-hosting story for the Agents of SigNoz hackathon.The struggles, the small victories, and the one feature that genuinely made me smile. If you are also planning to self-host SigNoz, I hope my journey saves you some time, and maybe a little bit of hair also.

Why I wanted to self-host in the first place
Before anything else, let me be very clear about what this blog is. This is my pre-hackathon part, the warm-up before the actual Agents of SigNoz hackathon even begins. That is, self-hosting SigNoz, sending some data into it, and exploring it properly. The real project, the one I will actually build during the hackathon, is a separate story, and I will happily write about that one later, during the build phase itself.
For this hackathon, the idea was simple. Run SigNoz as my own observability backend, send some data into it, explore what it can do, and then build something nice on top during the event. So I decided to first self-host it properly on my own machine, and this blog is all about that self-hosting journey.
SigNoz gives you a lovely little tool for this called Foundry. And I must say, the config it needs is almost embarrassingly small. This one file only is enough to bring up the whole SigNoz stack along with its MCP server:
apiVersion: v1alpha1
kind: Installation
metadata:
  name: signoz
spec:
  deployment:
    mode: docker
    flavor: compose
  mcp:
    spec:
      enabled: true
Then just three commands, and you are supposed to be done:
curl -fsSL https://signoz.io/foundry.sh | bash   # get the tool
foundryctl forge                                  # generate deploy files + lock
foundryctl cast                                   # bring everything up
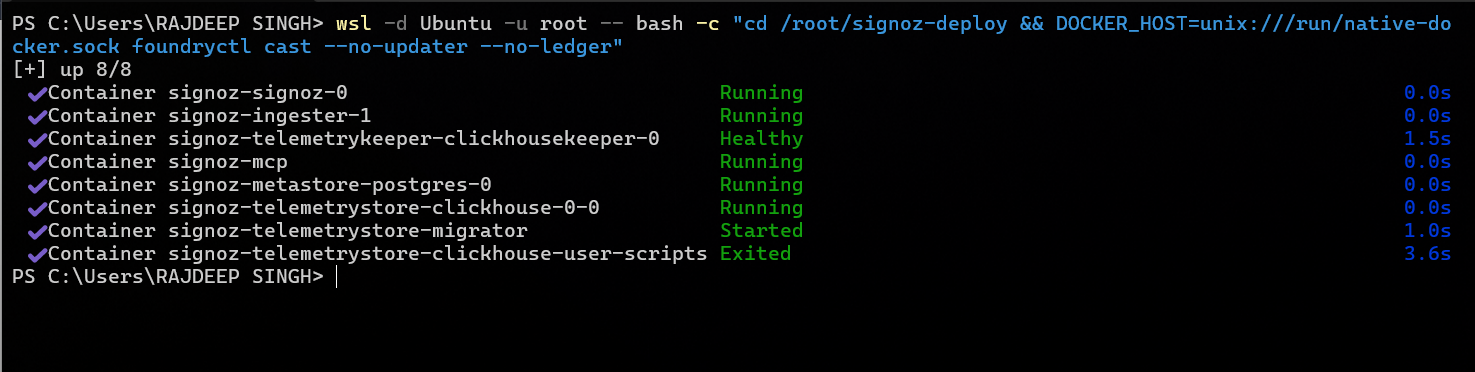
And honestly, it almost worked in one shot. Everything came up green. Almost everything, that is. One container had other plans.
But first, a two-hour fight with a segfault
There was this one container, clickhouse-keeper, the little coordination service that ClickHouse simply cannot live without. And it kept dying. Start, crash, restart, crash again. Poor thing was stuck in a loop.
I checked the exit code and it said 139. For those who have been here before, you already know the feeling. 139 means 128 plus 11, which is SIGSEGV, a segmentation fault. In simple words, the process touched some memory it was not allowed to, and fell flat on its face. On startup. Every single time.
And the logs? Almost useless, na. Just one line:
Processing configuration file '/etc/clickhouse-keeper/keeper.yaml'.
After that, nothing. No error, no stack trace, no goodbye even. Normally ClickHouse prints a big crash report when it segfaults, so getting complete silence meant it died before it could even set up its own crash handler. That is the kind of silence that makes you sit up straight.
So I did what any stubborn person would do. I tested everything, one by one.

Was it the CPU missing some instruction? No, the flags were all present. Out of memory? No. A broken binary? It ran --version perfectly. Was seccomp being too strict? I turned it off completely. Still dead. Was the ClickHouse watchdog misbehaving? I disabled it. Still dead. A version bug maybe? I tried two different versions. Both dead. I even ran it fully privileged, basically telling the machine to trust me blindly. Still dead. Transparent huge pages, the image store, one by one I checked and ruled out each thing.
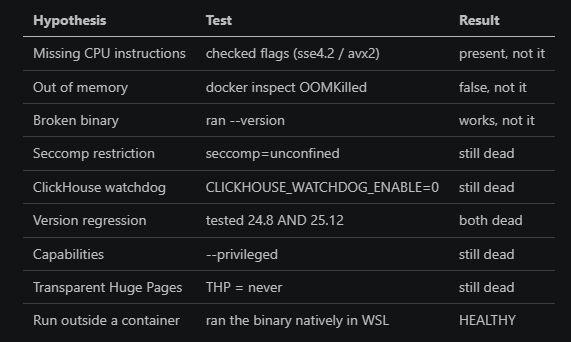
Eight theories, eight dead ends. By this point, trust me, I was taking it a little personally.

The moment it finally clicked
So I stopped testing inside Docker altogether. I pulled the actual clickhouse-keeper binary out of the image and ran it as a plain, simple process directly in my Ubuntu WSL shell. No container, nothing fancy.
docker cp <container>:/usr/bin/clickhouse-keeper /tmp/ck
strace -f /tmp/ck --config-file=/path/to/keeper-0.yaml
And it worked. It simply worked. Stayed up nicely, listening on port 9181, writing its little files, perfectly healthy.
That one observation told me the whole story:
The binary is fine. The kernel is fine. It only dies inside a container that Docker Desktop is running.
So the crash was somehow tied to my Docker Desktop container environment at that time. Same binary, same config, same kernel, but perfectly healthy as a raw process and dead inside a Docker Desktop container. Now, to be very frank with you, I could not fully pin down the exact reason, because I had a hackathon to build and not a Docker bug to chase. But one thing became very clear to me. The moment I ran things outside Docker Desktop, everything behaved nicely.
So I stopped fighting it, and decided to try a slightly different approach for my setup.
The fix that saved my evening
The logic was simple. If the raw Ubuntu kernel runs ClickHouse happily, then let me run the containers on a proper Docker Engine installed straight inside Ubuntu, and skip Docker Desktop’s VM completely.
curl -fsSL https://get.docker.com | sh
There was one small catch. Docker Desktop kept grabbing the default socket again and again, like a small child not wanting to share a toy. So I gave my native Docker its own separate socket, and told the two to stop fighting:
# /etc/systemd/system/docker.service.d/override.conf
[Service]
ExecStart=
ExecStart=/usr/bin/dockerd -H unix:///run/native-docker.sock --containerd=/run/containerd/containerd.sock
I pointed Foundry at that socket, ran the cast again, and finally:
Container signoz-telemetrykeeper-clickhousekeeper-0   Healthy
Container signoz-telemetrystore-clickhouse-0-0        Started
Healthy. That lovely green word. The whole stack up and running, the MCP server answering on port 8000, and the UI happily loading on localhost:8080. And the best part, it even survives a reboot now.

If you take away only one thing from this struggle, let it be this. If ClickHouse is segfaulting under Docker Desktop on Windows, kindly just run a native Docker Engine inside WSL instead. Simple.
Sending some data in
With a healthy backend ready, it was time to actually feed it something. The OpenTelemetry load generator (telemetrygen) makes this ridiculously easy:
docker run --rm --network signoz-network \
  ghcr.io/open-telemetry/opentelemetry-collector-contrib/telemetrygen:latest \
  traces --otlp-endpoint signoz-ingester-1:4317 --otlp-insecure \
  --service checkout-service --traces 200
I sent traces for three services, along with some metrics and logs. Then I quickly checked whether it really landed:
SELECT count() FROM signoz_traces.signoz_index_v3;
-- 1300
1,300 spans sitting nicely inside SigNoz. And that is when the actual fun started.
Now the part I really enjoyed: exploring SigNoz
Once the data was flowing, I spent a good amount of time just clicking around and exploring. Let me walk you through what I found, because this is the part that made all the earlier struggle feel worth it.
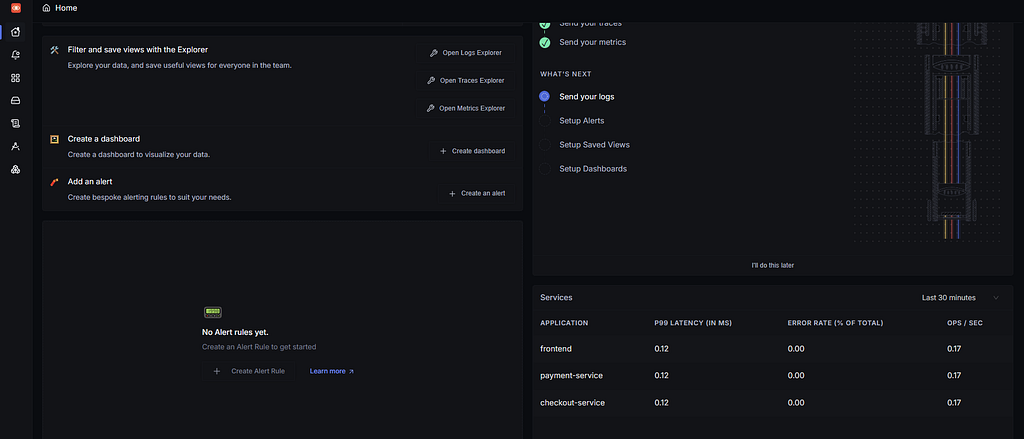
The Services page. The very first thing that made me happy. Without me configuring anything special, SigNoz showed all three of my services, that is payment-service, checkout-service and frontend, with their RED metrics ready. RED means Rate, Errors and Duration. Request rate, P99 latency, error percentage, everything sitting there neatly, and my error count was a clean zero across all of them.
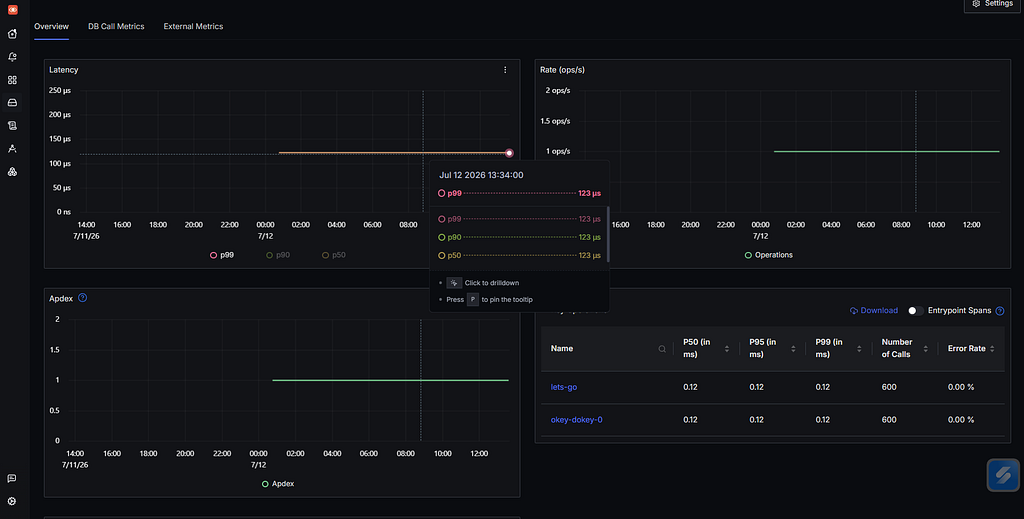
The Traces view. Next I opened a trace and got the waterfall view, that nice flamegraph style layout showing each span and exactly how long it took. I could see the actual structure very clearly, a lets-go client span calling an okey-dokey-0 server span, parent and child sitting one below the other in the waterfall. For anyone trying to find where exactly time is getting wasted in a request, this view is genuinely a blessing.
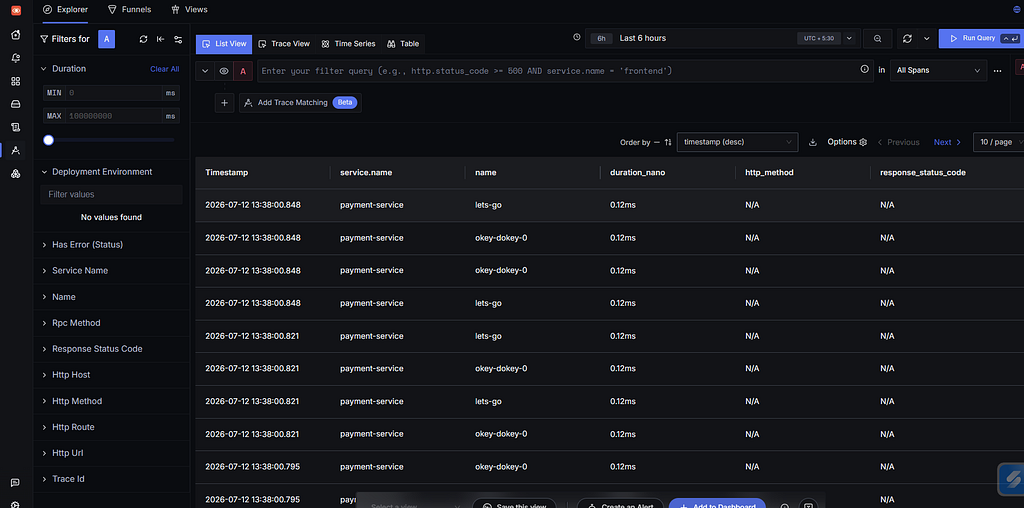
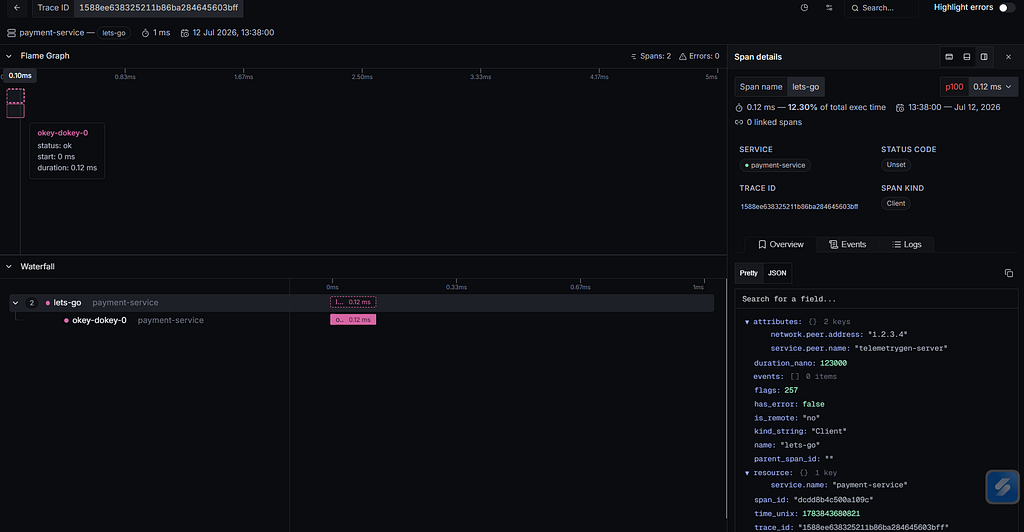
Metrics, Logs and Dashboards. I also spent time in the Logs explorer and the Metrics section, filtering and slicing the data. And the Dashboard builder, using the Query Builder, lets you make your own panels quite easily. As a first-time user, I found the whole thing surprisingly friendly.
And one more nice surprise, the MCP. SigNoz also runs an MCP server, which basically lets an AI agent talk to your observability data. So just to test it, I pointed an agent at it and simply asked for my services. And it came right back with real numbers, pulled live from my own SigNoz:
payment-service    600 calls, 0 errors
checkout-service   600 calls, 0 errors
frontend           600 calls, 0 errors
I must say, seeing an agent read my telemetry like that was a very nice moment.
If I must pick one favourite feature
Now if you force me to choose just one thing I loved the most, it is this. Inside a trace, I clicked on a slow span, and with one single click I jumped straight to the exact logs that were produced during that span. No hunting around, no copy-pasting a trace ID into some other tool, nothing.
That “everything is connected” idea sounds like marketing until you actually feel it once. And the moment you feel it, you understand why people keep saying one platform for every signal. For me, this trace-to-logs jump was the small feature that quietly won my heart. Traces, metrics and logs all sitting together and talking to each other, this is the thing I found most useful.
What all this made me want to build
Honestly, while exploring, one small itch kept coming back to me. When some requests go slow, SigNoz gives me every tool to investigate, filters, group by, breakout by, all of it. Wonderful tools. But I still have to sit and guess which attribute is the actual culprit. Is it a region issue, a bad build, one particular customer? I keep guessing, one by one.
There is a very famous feature in another tool, Honeycomb, called BubbleUp, which does this guessing for you automatically. And interestingly, SigNoz themselves have written that they want the community to build things like agent-native observability, including turning a debugging session directly into an alert rule.
So during the hackathon build phase, that is exactly what I am planning to build. A small loop I am calling Incident to Insight to Alert. The agent finds which attribute broke and explains it on a dashboard, and that whole middle part is the insight, and then it writes the SigNoz alert that would catch the same problem next time. Every incident quietly making your monitoring smarter.
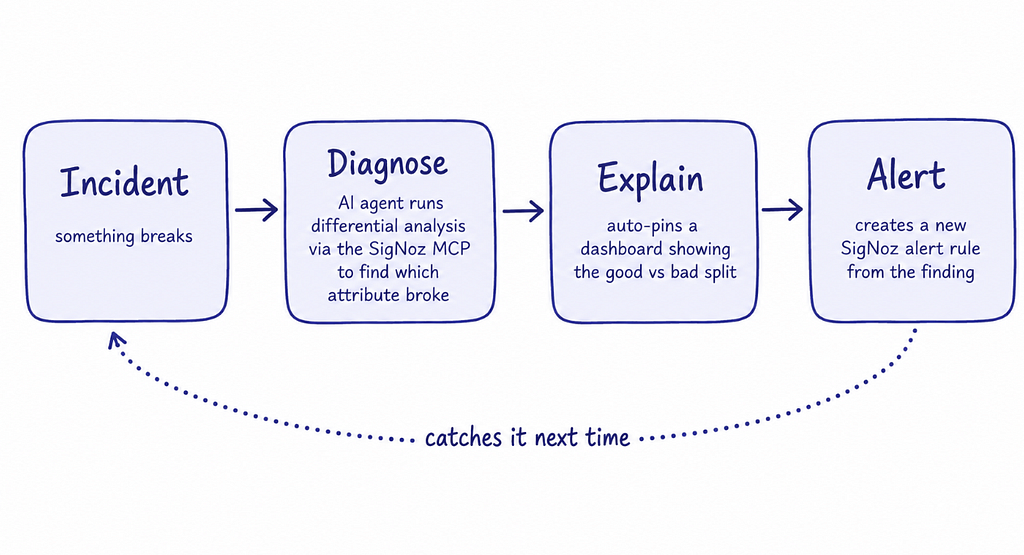
But let me be very clear and honest here, because I believe in playing fair. That project is for the build phase. As of now, here is exactly where things stand:
Already done:
- Self-hosted SigNoz plus its MCP server, using Foundry
- Telemetry flowing in nicely, traces, metrics and logs
- An agent reading that telemetry live through the MCP
Planned for the build phase:
- The differential engine that finds which attribute broke
- Auto-creating the dashboard and the alert
- The full loop working end to end
The exciting visuals, like the alert firing on its own after learning from an incident, I will happily capture during the actual build phase, not before.
What I would tell my past self
If I could send a small note back in time to myself before this whole adventure, it would say just three things:
- When a container crashes with no logs, step outside the container. Running the binary directly as a plain process told me more in five minutes than two hours of tweaking Docker flags did.
- Do not fight your environment, change it. I could have spent the whole night chasing that Docker Desktop mystery. Switching to a native Docker Engine inside WSL cost me fifteen minutes and ended the problem completely.
- Send data before judging the tool. An empty observability UI tells you nothing. The moment real traces started flowing, every feature suddenly made sense.
Wrapping up

So that is my honest little journey. A stubborn segfault, a lot of testing, one clean fix, and a backend that finally works and even survives reboots. If you are self-hosting SigNoz on Windows and ClickHouse starts troubling you, please remember my hard-earned lesson and just switch to a native Docker Engine inside WSL.
Do try SigNoz once, send some data, and click around a little. I think you will enjoy it as much as I did. And if you also feel that trace-to-logs jump for the first time, do come back and tell me, na. I would love to hear about it.
Written by Rajdeep Singh, a computer science student who loves building full-stack and AI things, and who occasionally fights segfaults for fun. Currently getting ready for the Agents of SigNoz hackathon.
Please do connect or say hello: X/Twitter · GitHub · LinkedIn · Medium.